
You need a FortiGate running FortiOS 7.x with CLI access, and a Linux server that the FortiGate can reach over UDP. The server runs the collector and the web interface; the FortiGate only has to send it NetFlow.
1. Install the NetFlow analyzer
On the Linux server (Debian, Ubuntu, Fedora, RHEL, Rocky or Alma; x86_64 or arm64):
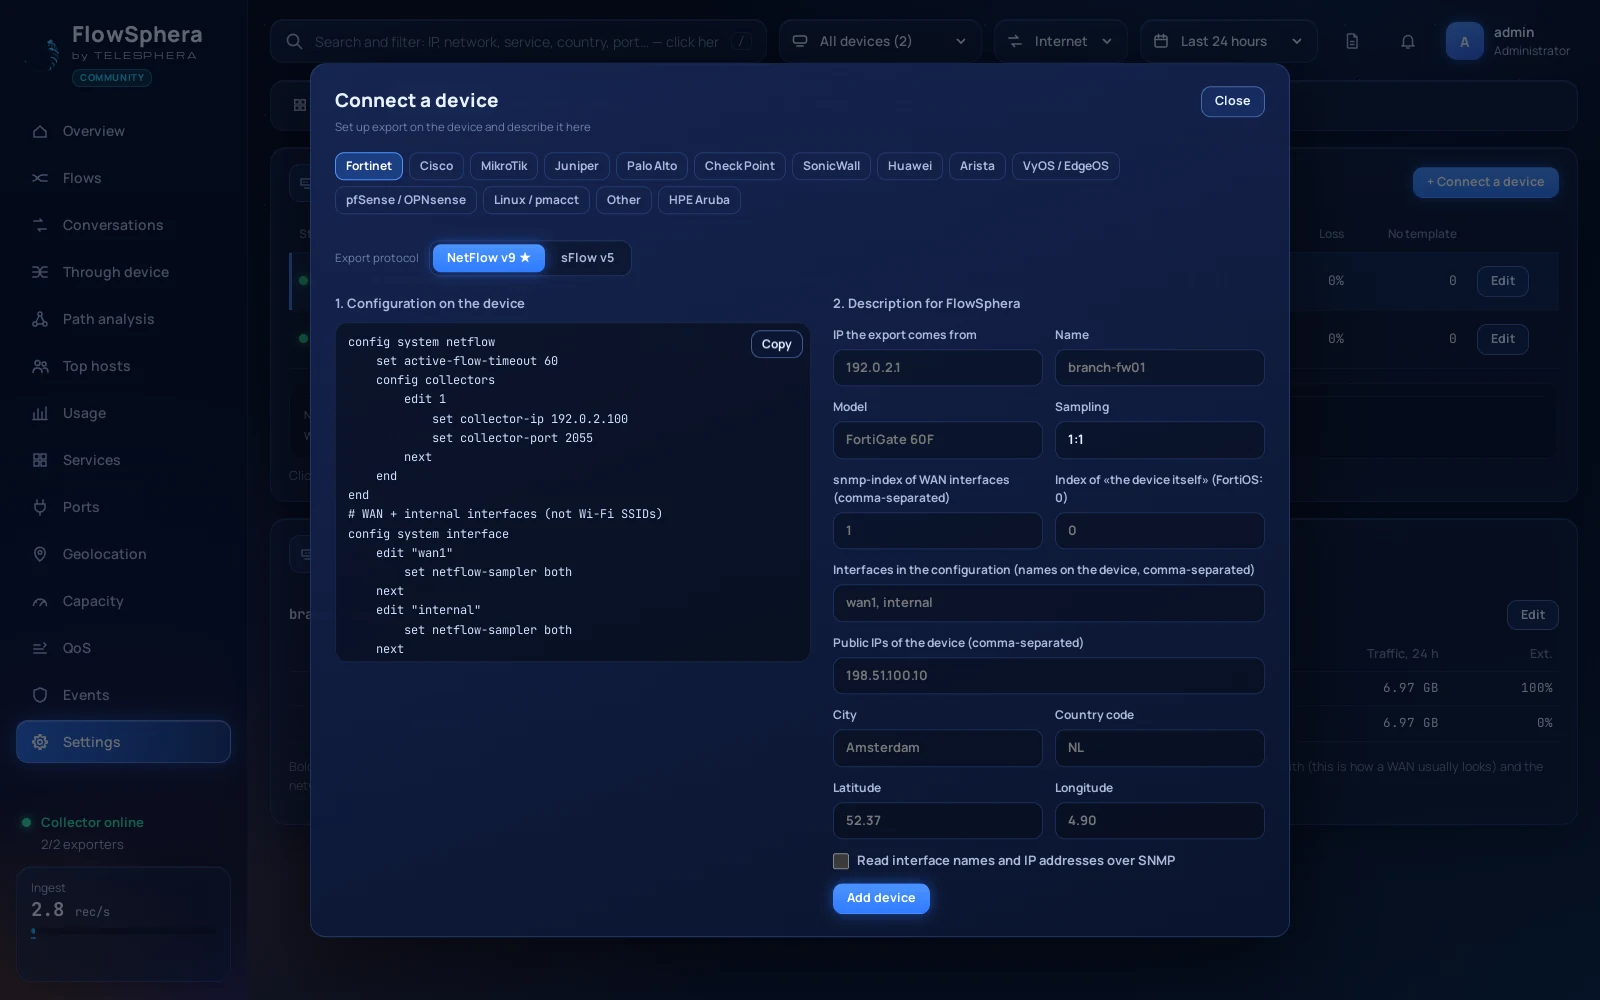
curl -fsSL https://raw.githubusercontent.com/telesphera/flowsphera/main/install.sh | sudo bashThe installer asks a few questions with defaults, among them your exporter type and its address, and finishes by printing the web address and the FortiGate configuration with your addresses filled in. Choose Fortinet when it asks. The listening port for NetFlow is 2055 unless it is busy.
2. Define the NetFlow collector on the FortiGate
In the FortiGate CLI, replace the two addresses: <COLLECTOR_IP> is the server that runs FlowSphera, <FW_LAN_IP> is the FortiGate's own address that can reach it.
config system netflow
    set active-flow-timeout 60
    config collectors
        edit 1
            set collector-ip <COLLECTOR_IP>
            set collector-port 2055
            set source-ip <FW_LAN_IP>
        next
    end
end
active-flow-timeout defaults to 30 minutes. At 60 seconds, long sessions show up in near real time instead of half an hour late.
3. Enable the NetFlow sampler on the interfaces
Switch it on for every interface whose traffic you want to see. On a small FortiGate that is the WAN and the internal interface; on larger models the names differ (port1, lan, a VLAN name).
config system interface
    edit "wan"
        set netflow-sampler both
    next
    edit "internal"
        set netflow-sampler both
    next
end
both means ingress and egress. FortiOS exports per session, so a session that crosses two sampled interfaces is still reported once. FortiOS starts exporting sessions created after the sampler was switched on, so open a few new connections to see data straight away.
To check what is configured on the FortiGate:
show system netflow
show full-configuration system interface | grep -f netflow-sampler4. Check that the FortiGate appears
Open the FlowSphera web address and sign in. The FortiGate shows up under Settings → Devices as soon as its first records arrive, and the overview starts filling within a minute. NetFlow v9 records can only be decoded after the device has sent its template; if the list stays empty, wait a few minutes before looking for a fault.
5. Add application names
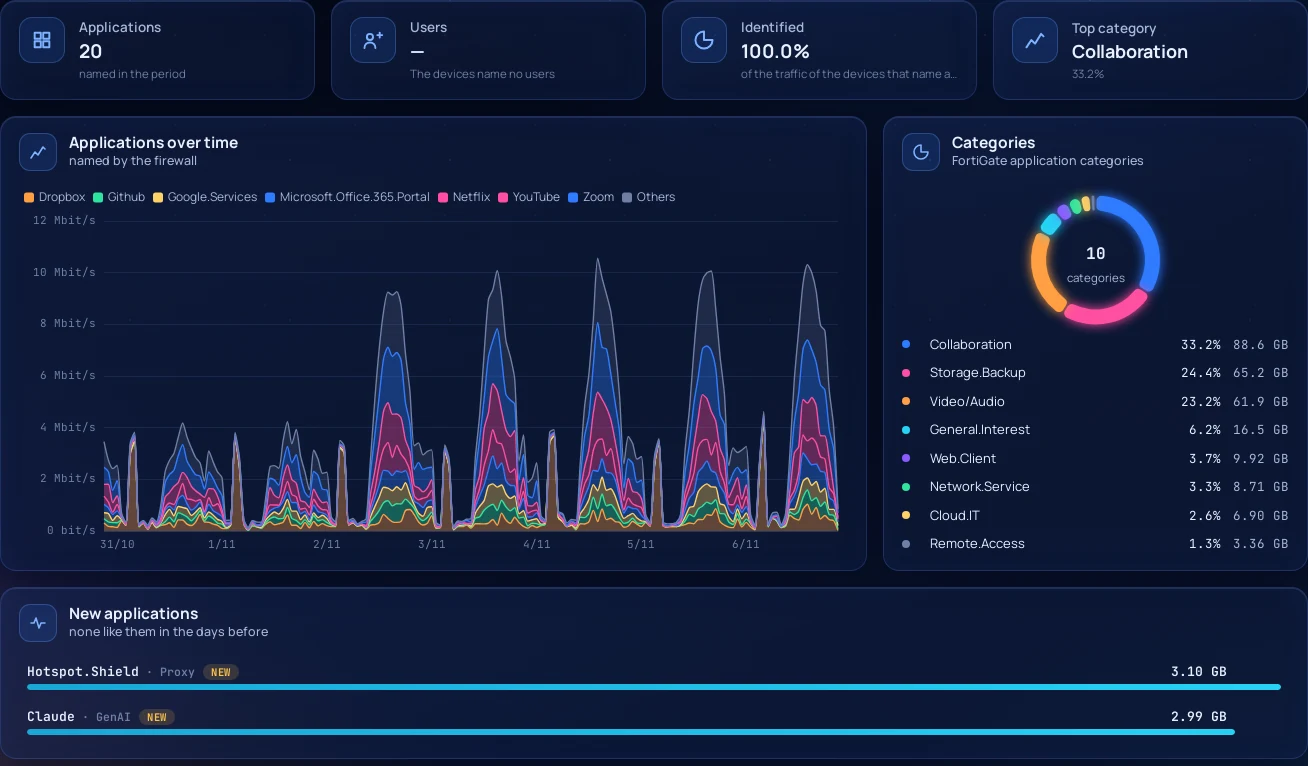
With Application Control in the firewall policies (a profile, even monitor-only), FortiOS puts the application id into every record and sends the names with their categories, slowly, a few at a time. FlowSphera keeps the names it learns and shows records stored before a name arrived under that name as soon as it is known. Settings → Devices says «applications: off» for a FortiGate that sends none.
Optional: interface names over SNMP
Tick Read interface names and IP addresses over SNMP in the device dialog and FlowSphera labels interfaces by name instead of by number. On FortiOS, three things catch people out:
- SNMP must be switched on:
config system snmp sysinfo→set status enable. Until then the daemon runs but never opens UDP 161. - An SNMPv3 user answers only the hosts listed in its
notify-hosts. Add the FlowSphera server there. - The interface the server reaches needs
allowaccess snmp. If the daemon still stays silent after the change, restart it withdiagnose test application snmpd 99.
If nothing arrives
- Can the FortiGate reach the server on UDP 2055? Allow the port in the server's firewall (the installer can do it for ufw and firewalld).
- Is
source-ipan address of the FortiGate that routes to the server? - Is
netflow-samplerset on at least one interface that carries traffic? - Were the connections created after the sampler was switched on?
Questions
Which interfaces should I enable NetFlow on?
Every interface whose traffic you want to see: the WAN for internet traffic, internal interfaces (LAN, VLANs, VPN tunnels) for traffic between your own networks. Sampling both directions is fine; FortiOS exports per session, so a session that crosses two sampled interfaces is still reported once.
Why is traffic between two Wi-Fi SSIDs missing?
Wi-Fi SSID (VAP) interfaces cannot be sampled on a FortiGate. Traffic between an SSID and a sampled interface is visible; traffic between two SSIDs is not.
Why do I only see new connections after enabling NetFlow?
FortiOS starts exporting sessions created after the sampler was enabled. Open a few fresh connections to see data at once.
Does a FortiGate send NetFlow or sFlow?
Both are available in FortiOS. This guide uses NetFlow v9 at full rate; FlowSphera also reads sFlow.
What you can see now
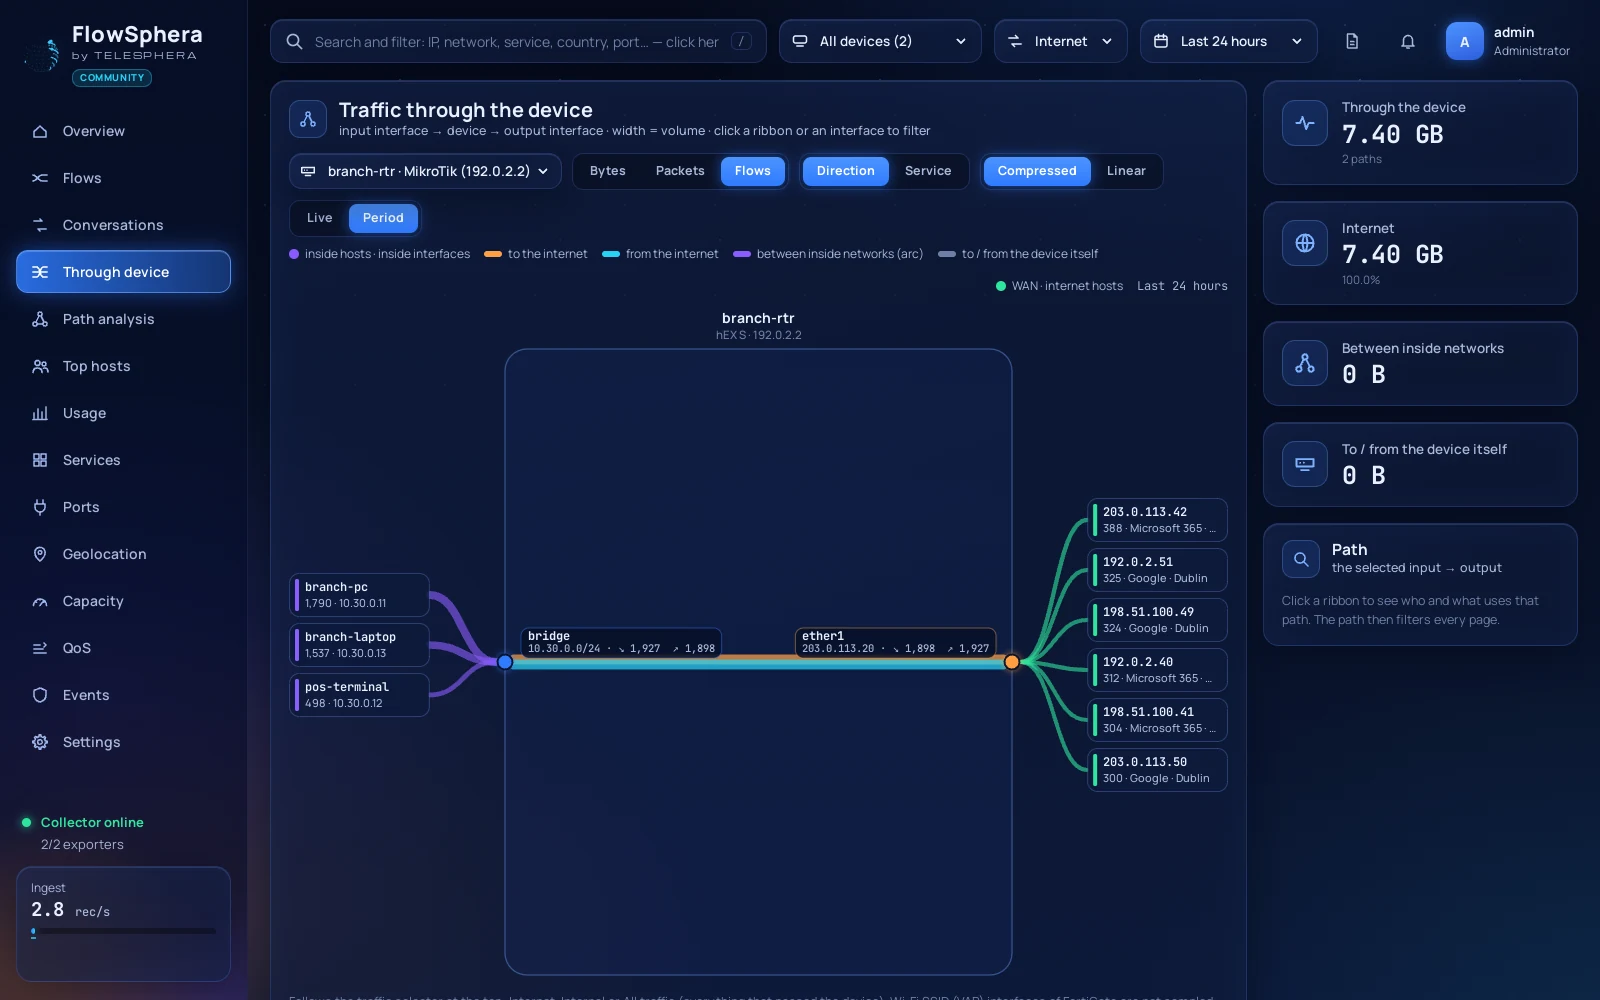
With flows arriving, FlowSphera for FortiGate shows live connections on a map, who talks to whom, traffic through each device interface by interface and security events with alerts to Telegram, e-mail, webhooks and your SIEM. The full configuration reference is in the exporter documentation.